AMBA APB · Module 14
Bus Utilisation
Real-world APB utilisation — useful versus overhead, wait, and idle cycles — for typical peripheral mixes. Control traffic is sparse and bursty, so the bus is normally mostly idle; the metric to watch is not peak throughput but unexpected saturation, which signals data traffic that belongs elsewhere.
Peak throughput tells you how fast the bus can move data; utilisation tells you how busy it actually is. The two are almost never the same number. The single idea to carry: an APB control bus is normally mostly IDLE — control traffic is sparse and bursty (configure a peripheral at boot, then silence), so average utilisation is low, and that is exactly what a healthy system looks like. The metric worth watching is not whether the bus hits its peak rate but whether it is unexpectedly saturated — because a busy control bus signals data traffic that belongs on a pipelined fabric, not behind the APB. This chapter takes the per-transfer cost from 14.1 and the peak rate from 14.2 and moves them into the time domain: over a real window, how do useful, overhead, wait, and idle cycles divide up, and what do the two ratios — efficiency and occupancy — actually mean?
1. Problem statement
The problem is measuring and interpreting how busy an APB really is over time — not its theoretical best, but the achieved fraction of cycles doing work for a real peripheral mix — and knowing what a "good" number looks like.
Peak throughput (14.2) is a ceiling: the rate the bus sustains if it never stops issuing transfers. Real systems do not behave that way. A control bus spends most of its life with nothing to do, punctuated by short bursts of register traffic. So the engineering questions are:
- How are the cycles of a window actually spent? Every clock is one of four things: a useful cycle (an ACCESS completion that moves data), an overhead cycle (a SETUP cycle — structurally mandatory but moves no data), a wait cycle (
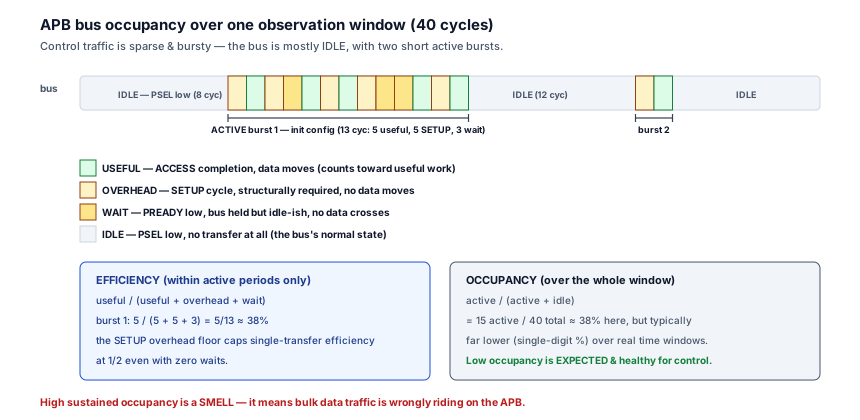
PREADYlow — the bus held but no data crossing), or an idle cycle (no transfer at all,PSELlow). Utilisation is a question about the proportions of these. - Which ratio are you even asking about? There are two, and conflating them is the classic error. Efficiency = useful / (useful + overhead + wait) — how well the bus spends its active cycles. Occupancy = active / (active + idle) — how much of all time the bus is active at all. A bus can be efficient and barely occupied, or busy and inefficient.
- What is a healthy value? For a control bus, low occupancy is correct. Control traffic is sparse; the bus should be mostly idle. So the alarm is not "utilisation is low" — it is "utilisation is unexpectedly high and sustained," which means something is hammering the bus that probably shouldn't be on it.
So the job is to classify a window's cycles, compute the two ratios, and read them correctly: a mostly-idle control bus is the expected, healthy state — and saturation is the symptom to investigate.
2. Why previous knowledge is insufficient
You have the unit cost and the ceiling; what you do not yet have is the time-domain reality that sits between them.
- 14.1 gave the per-transfer cost — but a cost is not an occupancy. APB latency anatomy pinned one transfer at exactly
2 + Ncycles. That is the atom. But knowing one transfer costs 4 cycles tells you nothing about whether the bus runs one transfer per microsecond or a thousand — utilisation is about how often the atom occurs over time, which the cost alone cannot answer. - 14.2 gave peak throughput — but peak is a ceiling no control bus lives at. APB throughput computed the maximum sustained rate, assuming the bus issues transfers back-to-back forever. That is the denominator's best case. Real control traffic is sparse and bursty, so achieved utilisation is far below peak — and the gap between "peak" and "achieved" is precisely this chapter's subject. Peak throughput and achieved utilisation are different numbers, and treating them as the same is the headline misconception.
- Neither prior chapter modelled idle time at all. Both were about active transfers. Utilisation's most important category — idle — was simply absent from the cost and throughput math, because both implicitly assumed the bus was always working. The instant you put a stopwatch on a real bus, idle dominates, and a model that ignores it cannot describe the bus you actually built.
What this chapter adds is the time-domain occupancy view: idle as a first-class category, the split between efficiency and occupancy, and the judgement that low occupancy is the expected outcome — feeding directly into the software-visible access cost (14.5) and the system-level impact (14.6) of where you place traffic.
3. Mental model
The model: picture a timeline strip of the bus, one cell per clock, and colour each cell by what it is doing. Most of the strip is pale and empty — idle, the bus's resting state. Here and there a short burst lights up: inside a burst, you see green useful cells (data actually moving), amber overhead cells (the mandatory SETUP of each transfer), and darker amber wait cells (PREADY low, the bus held but stalled). Step back, and the picture is unmistakable — a control bus is mostly pale, with occasional bright bursts. That picture is the answer: low occupancy, bursty activity.
Three refinements make it quantitative:
- Two ratios, measured over two different denominators. Efficiency looks only at the bright (active) region: useful / (useful + overhead + wait). Because every transfer pays one SETUP cycle of overhead, even a zero-wait, back-to-back stream caps efficiency at
1/2— half of every transfer is the SETUP overhead. Occupancy looks at the whole strip: active / (active + idle). The two answer different questions — "how well do we spend active cycles" versus "how much of the time are we active at all" — and you must say which one you mean. - Idle is the normal, dominant state — not waste. A control bus configures peripherals at init, then services the occasional event. Between those, it has genuinely nothing to do, so it idles. An idle control bus is not an underused resource you should be ashamed of; it is a bus correctly sized for sparse traffic. Driving occupancy up would mean inventing work that doesn't exist.
- Saturation is the signal that matters. Because healthy occupancy is low, a sustained high occupancy is anomalous and informative. It almost always means one of two things: a driver is spin-polling (turning a sparse check into a tight loop), or bulk data has been routed onto the APB where it doesn't belong. Either way, the high number is a smell, not an achievement — the inverse of how you read utilisation on a data bus.
4. Real SoC implementation
In a real SoC you measure utilisation with a small monitor that classifies every cycle and tallies it over a window. The classification is exactly the four categories; the two ratios fall straight out of the counters.
// APB utilisation monitor: classify every cycle over a window and
// compute efficiency (within active) and occupancy (over the window).
//   useful   = ACCESS completion cycle (data moves)  -> psel & penable & pready
//   overhead = SETUP cycle (structural, no data)     -> psel & ~penable
//   wait     = PREADY-low stall (bus held, no data)  -> psel & penable & ~pready
//   idle     = no transfer at all                    -> ~psel
localparam int WINDOW = 1024;                  // observation window, in PCLK cycles
logic [31:0] useful_cnt, ovhd_cnt, wait_cnt, idle_cnt, win_cnt;

wire is_useful = psel &  penable &  pready;    // exactly one per completed transfer
wire is_ovhd   = psel & ~penable;              // exactly one SETUP per transfer
wire is_wait   = psel &  penable & ~pready;    // each PREADY-low ACCESS cycle (N total)
wire is_idle   = ~psel;                        // PSEL low: bus doing nothing

always_ff @(posedge pclk or negedge presetn) begin
  if (!presetn) begin
    useful_cnt <= '0; ovhd_cnt <= '0; wait_cnt <= '0; idle_cnt <= '0; win_cnt <= '0;
  end else if (win_cnt == WINDOW-1) begin
    // ---- end of window: sample the ratios, then clear ----
    // active   = useful + ovhd + wait
    // EFFICIENCY = useful / active            (how well active cycles are spent)
    // OCCUPANCY  = active / WINDOW            (how much of all time is active)
    // For a control bus, OCCUPANCY is normally low (single-digit %) and that is healthy.
    useful_cnt <= '0; ovhd_cnt <= '0; wait_cnt <= '0; idle_cnt <= '0; win_cnt <= '0;
  end else begin
    useful_cnt <= useful_cnt + is_useful;
    ovhd_cnt   <= ovhd_cnt   + is_ovhd;
    wait_cnt   <= wait_cnt   + is_wait;
    idle_cnt   <= idle_cnt   + is_idle;
    win_cnt    <= win_cnt    + 1'b1;
  end
end
Two facts make this the right instrument. First, the four categories are mutually exclusive and exhaustive — every cycle is exactly one of useful/overhead/wait/idle, so useful + ovhd + wait + idle == WINDOW by construction, and any drift means the monitor is mis-sampling. Second, the two ratios come from the same counters but ask different questions: efficiency divides by active, occupancy divides by WINDOW. Worked example for an init-burst vs a steady-poll workload over a 1000-cycle window: an init burst of 50 zero-wait transfers is 50 useful + 50 overhead = 100 active cycles, so efficiency = 50/100 = 50% (the floor — pure SETUP overhead, no waits) and occupancy = 100/1000 = 10%. A steady poll that idly reads a status register once every 100 cycles runs maybe 5 transfers = 5 useful + 5 overhead = 10 active, so efficiency = 50% again but occupancy = 10/1000 = 1%. Same efficiency, ten-times-lower occupancy — the bus is doing the same kind of work, far less often. That is the distinction the whole chapter turns on, and the monitor is what makes it a number you can put in a regression report.
5. Engineering tradeoffs
Utilisation is two ratios over four cycle classes. The table fixes what each cycle is, what it counts toward, and its typical fraction; the second table shows how three real workload profiles occupy the bus.
| Cycle class | What it is | Counts toward | Typical fraction (control bus) |
|---|---|---|---|
| Useful | ACCESS completion (PSEL & PENABLE & PREADY) — data moves | Numerator of efficiency | Small absolute count; ≤ 1/2 of active cycles |
| Overhead (SETUP) | The mandatory SETUP cycle (PSEL & ~PENABLE) — structural, no data | Denominator only (active) | Exactly one per transfer; ≥ 1/2 of a zero-wait active stream |
| Wait | PREADY low in ACCESS (PSEL & PENABLE & ~PREADY) — bus held, no data | Denominator only (active) | 0 for fast regs; large for flash/CDC slaves |
| Idle | No transfer (~PSEL) — bus doing nothing | Denominator of occupancy | Dominant — usually the vast majority of cycles |
| Workload profile | Activity pattern | Efficiency (within active) | Occupancy (over window) | Read it as |
|---|---|---|---|---|
| Init burst | Dense back-to-back config writes at boot, then silence | ~50% (overhead-bound, low waits) | High briefly, then ~0% | Normal — a short spike, then idle |
| Steady polling | Periodic status reads at a low rate | ~50% | Low single-digit % | Normal if the period is sane |
| Idle / event-driven | Bus touched only when an interrupt fires | n/a (rare active) | ~0% | The healthy steady state |
The throughline: efficiency is structurally capped near 50% for APB (the SETUP overhead is unavoidable and there is no pipelining to amortise it — see 14.1), so chasing efficiency is mostly futile. Occupancy is the number that carries information, and for a control bus its healthy value is low. You are not trying to raise occupancy; you are watching for it to be unexpectedly high, which means polling or misplaced data — a problem to fix, not a target to hit.
6. Common RTL mistakes
7. Debugging scenario
The signature utilisation bug is not a functional failure but an occupancy anomaly: a control bus measured far busier than control traffic could possibly justify — and the monitor is exactly what surfaces it.
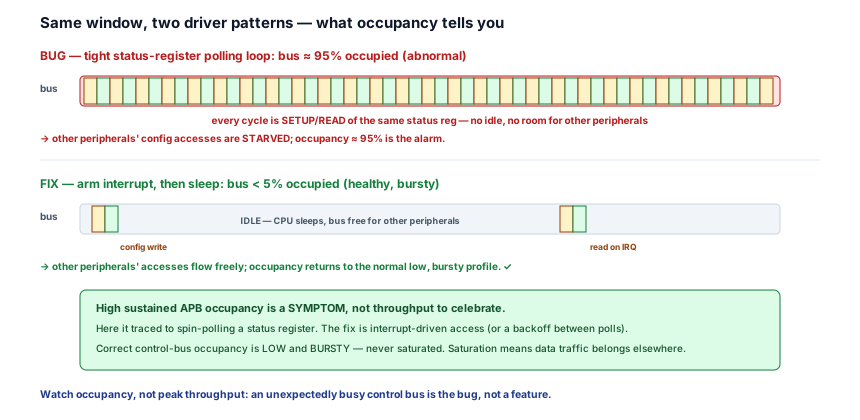
- Observed symptom: a regression's utilisation monitor reports the APB at ~95% sustained occupancy, and other peripherals' configuration accesses are intermittently delayed — a touch-screen controller's setup writes miss their timing window. Functionally nothing is wrong; the bus is simply pathologically busy for a control fabric, and that busyness is starving other masters' accesses.
- Waveform clue: the trace shows back-to-back reads of a single status register address with no idle gaps —
SETUP, ACCESS-complete, SETUP, ACCESS-complete, …repeating for thousands of cycles. The useful and overhead counters are both huge and roughly equal (efficiency ~50%), the idle counter is near zero, and every transfer targets the same address. The bus is fully occupied doing the same read over and over. - Root cause: a driver is spin-polling a peripheral's status register in a tight software loop —
while (!(read(STATUS) & DONE));— turning what should be a sparse, event-driven check into a saturating stream of identical reads. The bus is doing real, protocol-correct transfers, but they accomplish almost nothing useful and they monopolise the fabric, starving every other peripheral's config traffic. - Correct RTL: there is nothing to fix in the bus RTL — the transfers are legal. The fix is in the access pattern: replace the poll with an interrupt (
arm the DONE interrupt, sleep, read the register once when it fires), or, where polling is unavoidable, add a backoff (poll on a timer, not in a tight loop) so the bus returns to its normal low, bursty occupancy and other peripherals get cycles. If genuinely high-rate data is the real need, it does not belong on the APB at all — move it to a pipelined fabric (14.6). - Verification assertion: add a utilisation coverpoint/assertion that flags abnormal sustained occupancy and same-address hammering, so this trips in regression rather than the lab:
Azvya Education Pvt. Ltd.VLSI MentorSnippet
// Flag a control bus that is implausibly busy over a window. // active = useful + overhead + wait ; assert occupancy stays below a sane cap. property p_occupancy_sane; @(posedge pclk) disable iff (!presetn) (win_cnt == WINDOW-1) |-> ((useful_cnt + ovhd_cnt + wait_cnt) <= (WINDOW * MAX_OCCUPANCY_PCT) / 100); endproperty assert property (p_occupancy_sane) else $error("APB occupancy %0d%% exceeds control-bus budget — polling or misplaced data?", ((useful_cnt + ovhd_cnt + wait_cnt) * 100) / WINDOW); // And cover the smell directly: many consecutive same-address completions. cover property (@(posedge pclk) (psel && penable && pready && (paddr == $past(paddr,2)))[*64]); - Debug habit: when a control bus is "busy," do not be impressed — be suspicious. Run the utilisation monitor, and if occupancy is high and sustained, histogram the target addresses. A flat distribution dominated by one address is a polling loop; a flood of bulk-data addresses is traffic on the wrong bus. Either way the high number is the symptom; the fix is changing the access pattern (interrupt/backoff) or relocating the traffic, never accepting saturation as normal on a control fabric.
8. Verification perspective
Utilisation is a measured property, so the verification job is to instrument it, cover both ratios, and turn "the bus is unexpectedly saturated" into a caught failure — performance regression beside functional regression.
- Bind a utilisation monitor and assert the partition is exact. Every cycle must classify as exactly one of useful/overhead/wait/idle, so assert
useful + overhead + wait + idle == WINDOWper window. This is not a protocol check — it validates that the monitor is counting honestly, so the occupancy and efficiency numbers feeding the performance dashboard are trustworthy. A monitor that double-counts (or drops) a cycle reports confident, wrong utilisation. - Cover occupancy and efficiency as separate axes. Because they answer different questions, cover them independently: bin occupancy (idle / low / moderate / high) and efficiency (the ~50% floor vs wait-degraded) so the suite demonstrates it exercised both a healthy-idle bus and an unusually busy one. A suite that only ever runs init bursts reports great coverage while never observing the steady-state idle profile — or the saturation that is the actual bug.
- Flag abnormal sustained occupancy as a failure, not a metric. For a control bus, assert occupancy stays under a sane cap over a window (the
p_occupancy_saneproperty above), and cover the same-address-hammering pattern that signals polling. This converts "the bus is mysteriously busy" from a lab surprise into a regression failure — which is the whole point of measuring utilisation early. - Cover the workload profiles explicitly. Build directed/random stimulus for the three profiles — init burst, steady polling, event-driven idle — and assert each produces its expected utilisation signature (brief spike, low single-digit, near-zero). This proves the system behaves correctly across the traffic patterns it will actually see, not just one synthetic burst.
The point: instrument utilisation, assert the four-way partition is exact, cover occupancy and efficiency as distinct axes plus the workload profiles, and assert a per-window occupancy cap — so an unexpectedly saturated control bus is regressed, not discovered in silicon.
9. Interview discussion
"What's the typical utilisation of an APB?" is a judgement filter. The weak answer reaches for a peak-throughput number; the strong answer reframes the question, because the expected utilisation of a control bus is low.
Lead with the reframing: APB is a control bus, and control traffic is sparse and bursty — configure peripherals at boot, then mostly silence — so achieved utilisation is normally low, and that is healthy, not wasteful. Then separate the two ratios cleanly: efficiency = useful/(useful+overhead+wait), which is structurally capped near 50% because every transfer pays one mandatory SETUP cycle of overhead and APB cannot pipeline it away; and occupancy = active/(active+idle) over time, which is the number that actually carries information and is normally single-digit percent. The senior flourish is to invert the usual instinct: "On a data bus, high utilisation is good. On a control bus, high sustained utilisation is a smell — it means a driver is spin-polling, or bulk data has been wrongly routed onto the APB; the fix is an interrupt or a backoff, or moving the traffic to a pipelined fabric." Saying "I watch occupancy, not peak throughput, and a busy control bus is the bug, not the achievement" signals you have actually profiled an APB subsystem and understand what it is for.
10. Practice
- Classify a window. Given a 1000-cycle window with 60 useful, 60 overhead, 20 wait, and 860 idle cycles, compute efficiency and occupancy, and state which is the more informative number here.
- Why ~50%? Explain why a zero-wait, back-to-back APB stream cannot exceed ~50% efficiency, and tie it to the SETUP-overhead cost from 14.1.
- Two profiles, same efficiency. An init burst and a steady poll both report 50% efficiency but 10% vs 1% occupancy. Explain what differs between them and why occupancy, not efficiency, distinguishes them.
- Read a saturated bus. A control bus measures 95% occupancy with nearly all transfers hitting one address. State the most likely root cause and the two fixes.
- Write the monitor. From memory, sketch the four wire classifications (useful/overhead/wait/idle) and the two ratios, and the assertion that the four counts sum to the window length.
11. Q&A
12. Key takeaways
- Peak throughput and achieved utilisation are different numbers. Peak (14.2) is the ceiling assuming non-stop transfers; achieved utilisation is far below it because a control bus is mostly idle. Never quote peak as the running load.
- Every cycle is one of four classes: useful (ACCESS completion, data moves), overhead (mandatory SETUP, no data), wait (
PREADYlow, held but stalled), and idle (no transfer). Utilisation is a question about their proportions. - Two ratios, two denominators. Efficiency = useful/active (capped near 50% by the unavoidable SETUP overhead); occupancy = active/total (the informative number). They are independent — a bus can be 50% efficient and 1% occupied.
- Low occupancy is healthy for a control bus. Control traffic is sparse and bursty, so the bus should be mostly idle. There is no spare capacity being wasted; the bus is correctly sized.
- High sustained occupancy is a smell, not a success. It signals spin-polling (fix: interrupt or backoff) or bulk data on the wrong bus (fix: move it to a pipelined fabric — 14.6). Watch occupancy, not peak throughput; a busy control bus is the bug.
- Verify utilisation as a measured property: bind a monitor, assert the four classes sum to the window, cover occupancy and efficiency as distinct axes plus the workload profiles, and assert a per-window occupancy cap so a saturated control bus is caught in regression, not the lab.