AMBA AHB · Module 20
Case Study: Debug Subsystem
A worked case study showing how an external debugger reaches the on-chip AHB fabric — via a debug access port that acts as an AHB master. The debug access port translates a slow serial debug protocol (JTAG/SWD) into AHB transactions and acts as a full AHB master on the bus, so the debugger can read and write all of the chip's memory and peripherals. The flow: the host sends a serial command, the debug access port requests the bus as a master, the arbiter grants it at a boundary, it runs an ordinary AHB read or write, and the result goes back over the serial link. The bus transaction is completely ordinary — the slow part is the serial link, not the bus. Because it's a separate master, the debugger can access the bus while the CPU runs (non-intrusive) or is halted, with arbitration sharing the bus.
The fifth case study answers a practical question: how does an external debugger see and control everything inside the chip? The answer is elegant — it becomes an AHB master. A debug subsystem lets an external debugger (a host PC running debug software, connected over a slow serial link like JTAG or SWD) reach the chip's internal AHB fabric through a debug access port (DAP). The DAP translates the serial debug protocol into AHB transactions and acts as a full AHB master on the bus — so the debugger can read and write all of the chip's memory and peripherals by issuing ordinary AHB transactions. The flow: the host sends a serial command (e.g. "read this address"); the DAP requests the bus as a master (HBUSREQ); the arbiter grants it (at a boundary, like any master); the DAP runs an ordinary AHB read/write; and the result goes back over the serial link. The key insight: the bus transaction is completely ordinary — the slow part is the serial link, not the bus. And because the DAP is a separate master, the debugger can access the bus while the CPU runs (non-intrusive inspection) or while it's halted — with arbitration sharing the bus. This chapter traces a debug read and shows how full system visibility comes from being a master.
1. What Is It?
This case study shows the debug subsystem — the debugger as an AHB master. The path:
- External debugger → DAP — a host PC, over a slow serial link (JTAG/SWD), talks to the debug access port on the chip.
- DAP = a full AHB master — it translates serial commands into AHB transactions and drives the bus as a master (
HBUSREQ/HGRANT/HMASTER, reads/writes). - Ordinary AHB access — a debug read/write is an ordinary AHB transaction; the slow part is the serial link, not the bus.
- Separate master — the debugger can access the bus while the CPU runs (non-intrusive) or halted; arbitration shares the bus.
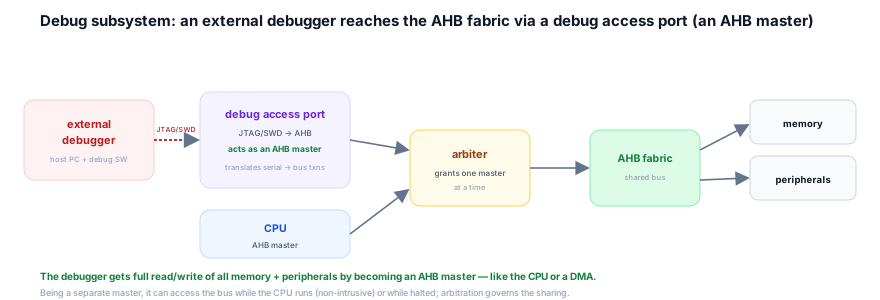
So the debug subsystem shows the power of the AHB master abstraction: by making the debugger a master, it gets the same full read/write access to every slave that the CPU has. The value of tracing it is seeing that debug visibility isn't magic — it's the debugger driving ordinary AHB transactions through a master (the DAP). The DAP bridges the external, slow, serial world (JTAG/SWD) to the internal, fast, parallel AHB bus — and once it's a master, it can do anything the CPU can: read any memory, write any register, inspect any peripheral. So this case study shows debug as a master. So full visibility comes from being a master.
2. Why Does It Exist?
This case study exists because debug access is essential (you can't develop or diagnose a chip without it) — and it demonstrates the power of the master abstraction (the debugger gets full access just by being a master) — and it reinforces multi-master (the DAP is another master, sharing the bus via arbitration, with the non-intrusive twist).
The debug access is essential is the root: you can't bring up, develop firmware for, or diagnose a chip without a way to see and control its internals — read memory, set breakpoints, inspect registers. So a debug subsystem is essential infrastructure. So understanding it is important. So this case study exists to cover the debug path. So debug is essential. So know how it works.
The the master abstraction is powerful is the lesson: the elegant part is that the debugger gets full read/write of everything just by being an AHB master — no special "debug bus", no per-slave debug logic. So this case study demonstrates the power of the master abstraction — one uniform mechanism (be a master) gives full access. So it exists to show that power. So it's the abstraction lesson. So be a master, get everything.
The it reinforces multi-master (non-intrusively) is the connection: the DAP is another master (like the DMA), sharing the bus via arbitration — but with a twist: it can access the bus while the CPU runs (non-intrusive). So this case study reinforces multi-master and adds the non-intrusive concept. So it exists to extend the multi-master picture. So it's the multi-master reinforcement. So share the bus, even while the CPU runs. So this case study exists because: debug access is essential (you can't develop/diagnose without it — the root); the master abstraction is powerful (full access just by being a master — the lesson); and it reinforces multi-master (another master, non-intrusively — the connection). So the debug-subsystem case study is the debug path — demonstrating that full visibility comes from being an AHB master. So this chapter covers debug. So make the debugger a master, and share the bus.
3. Mental Model
Model the debug subsystem as a building inspector with a master key and a walkie-talkie to headquarters. Headquarters (the external debugger) wants to know what's in room 412 (a memory address). They radio the inspector (the slow serial link — JTAG/SWD). The inspector (the debug access port) is inside the building and holds a master key (is an AHB master) that opens every door. They wait for the hallway to be clear of the resident who's also moving around (arbitration with the CPU), walk to room 412, unlock it, read what's inside (an ordinary AHB read), and radio the answer back to headquarters. The radio is slow — that's the bottleneck — but once inside, the inspector moves at full building speed with full access. And crucially, the inspector can do this whether the resident is home and active (CPU running — non-intrusive) or asleep (CPU halted). Full access to the whole building, from outside, via one person inside with a master key.
A building where headquarters (the external debugger) wants to inspect the inside, but is outside. They have an inspector inside (the debug access port) with a master key (the DAP is an AHB master — it can access every slave) and a walkie-talkie to headquarters (the slow serial link — JTAG/SWD). When HQ wants to know what's in room 412 (a memory address), they radio the inspector (send a serial command). The inspector waits for the hallway to be clear of the resident also moving around (arbitration with the CPU), walks to room 412, unlocks it, reads what's inside (an ordinary AHB read), and radios the answer back (returns the data over serial). The radio is slow — that's the bottleneck (the serial link, not the bus) — but once inside, the inspector moves at full building speed with full access (the bus transaction is ordinary and fast). And crucially, the inspector can do this whether the resident is home and active (CPU running — non-intrusive) or asleep (CPU halted). Full access to the whole building, from outside, via one person inside with a master key.
This captures the debug subsystem: headquarters outside = the external debugger; the walkie-talkie = the slow serial link (JTAG/SWD); the inspector inside with a master key = the debug access port as an AHB master; radioing "what's in room 412" = the host sending a serial read command; waiting for the hallway to be clear = arbitration with the CPU; walking in and reading the room = the ordinary AHB read; radioing the answer back = returning the data over serial; the slow radio being the bottleneck = the serial link being the slow part (not the bus); working whether the resident is active or asleep = accessing the bus while the CPU runs (non-intrusive) or is halted; the master key opening every door = the master abstraction giving full access. Give the inspector a master key (make the DAP a master) and a radio to HQ (the serial link), and HQ can inspect the whole building from outside.
Here is a debug read traced — the DAP as a master:
A debug read: the DAP becomes a master and drives an ordinary AHB read
5 cyclesThe model's lesson: give the inspector a master key (make the DAP a master) and a radio to HQ (the serial link), and HQ can inspect the whole building from outside. In the figure, the DAP requests, is granted at a boundary (like any master), and drives an ordinary AHB read — the bus part is unremarkable; the power is that being a master gives full access, and the only slow part is the serial link to the host.
4. Real Hardware Perspective
The substance behind the trace is the multi-master structure you've learned — so each step maps to a chapter, applied to the DAP.
The the DAP as a master: in hardware — the DAP asserts HBUSREQ, the arbiter grants (HGRANT, at a boundary, HMASTER → DAP), and the DAP drives reads/writes. So the trace applies the multi-master structure (see DMA Master on AHB, Why Arbitration, HBUSREQ / HGRANT, HMASTER). So it's another master. So request, grant, drive.
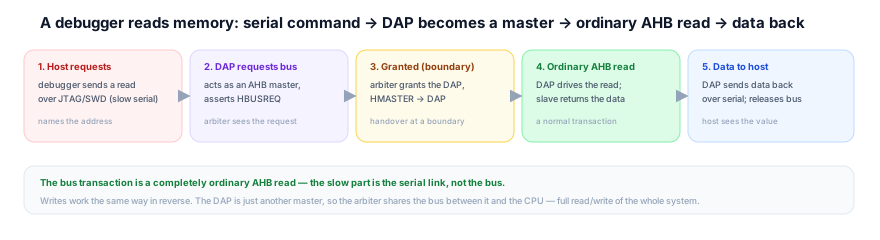
The the ordinary transaction and the access: in hardware — the DAP's bus access is an ordinary AHB read/write (the same as the CPU's); the access is full (every slave) because the DAP is a master. So the trace applies the read/write and master structure (see CPU to SRAM, Master/Slave/Decoder/Arbiter, Bus Ownership Handover). So in practice, the debug path is the multi-master structure applied — the DAP a master, driving ordinary transactions, with the serial link the only slow part. So in practice, know the multi-master structure and trace the DAP. So that's the debug path.
5. System Architecture Perspective
At the system level, the debug subsystem shows that the master interface is the universal access point — anything that needs full access to the system (CPU, DMA, debugger) becomes a master — and it adds the non-intrusive dimension (the debugger reading the live system without stopping it), which the multi-master bus enables.
The the master interface is the universal access point: every agent that needs full read/write of the system — the CPU (runs code), the DMA (moves data), the debugger (inspects/controls) — gets it by being a master. So the master interface is the universal way to access the system. So at the system level, being a master is how you get full access. So make access-needers masters. So it's universal.
The non-intrusive debug: because the debugger is a separate master, it can read the live system while the CPU runs — without stopping it. This is non-intrusive debug (watching variables, profiling) — enabled by the multi-master bus (two masters sharing). So at the system level, the multi-master bus enables non-intrusive observation. So watch the live system. So it's the non-intrusive win. So at the system level, the debug subsystem shows that the master interface is the universal access point (CPU, DMA, debugger all become masters for full access) and adds non-intrusive debug (reading the live system without stopping it, enabled by the multi-master bus). So the debug subsystem is where the master abstraction's generality shows — making being a master the universal key to full system access, non-intrusively. So make the debugger a master, and observe non-intrusively. So the master interface is the universal access point.
6. Engineering Tradeoffs
Tracing the debug path surfaces the debug-access design points.
- Master-based debug vs special debug logic. Making the debugger an AHB master gives full access via one uniform mechanism; per-slave debug logic would be redundant. Be a master.
- Serial link speed vs bus speed. The serial link (JTAG/SWD) is the slow part (kHz–MHz); the bus transaction is fast. So debug throughput is limited by the link, not the bus.
- Non-intrusive vs halted debug. Non-intrusive (CPU runs) lets you watch the live system (but you contend for the bus); halted (CPU stopped) gives a frozen snapshot. Use each as needed.
- Debug access vs security. A debugger-as-master can read/write everything — powerful for development, but a security concern in production (hence debug lock/authentication mechanisms).
The throughline: the debug subsystem makes the debugger an AHB master — full read/write of all memory/peripherals by driving ordinary AHB transactions. The flow: host serial command → DAP requests the bus → arbiter grants (at a boundary) → ordinary AHB read/write → result back over serial. The slow part is the serial link, not the bus. As a separate master, the debugger accesses the bus while the CPU runs (non-intrusive) or halted, sharing via arbitration. At the system level, the master interface is the universal access point, and the multi-master bus enables non-intrusive debug.
7. Industry Example
A concrete trace — a developer debugging firmware with a hardware debugger.
A developer connects a hardware debug probe to a microcontroller's SWD pins and uses an IDE to inspect the running firmware.
- The host requests a memory read. The developer hovers over a variable in the IDE; the debug software sends a "read address X" command over SWD to the chip's debug access port. SWD is slow — a serial protocol — so this command takes many bus-clock-equivalents to arrive.
- The DAP becomes a master. The DAP decodes the serial command and, to perform the read, asserts
HBUSREQto the arbiter — it wants the bus, just like the CPU or a DMA would. - The arbiter grants the DAP. At a transfer boundary (the CPU's current transfer complete, not mid-burst), the arbiter switches
HMASTERto the DAP. The DAP now owns the bus for its access. - The DAP drives an ordinary read. It drives address X on
HADDR,HWRITElow — a normal AHB read. The decoder routes it to the slave holding X (SRAM, or a peripheral register), which returns the data onHRDATA. The DAP captures it. This bus transaction is utterly ordinary. - The result goes back over SWD. The DAP sends the captured value back to the host over the serial link (again, slow), and the IDE displays the variable's value.
- Non-intrusive or halted. The developer did this while the firmware was running — non-intrusively watching a live variable, the DAP momentarily sharing the bus with the CPU. Alternatively, they could set a breakpoint to halt the CPU and inspect a consistent frozen state. Either way, the DAP-as-master mechanism is the same.
- Full access. The same mechanism lets the developer read/write any memory, any peripheral register, set breakpoints, single-step — full visibility and control, because the DAP is a master that reaches every slave.
The example shows the debug path in action: the host sends a slow serial command, the DAP becomes a master and drives an ordinary AHB transaction, and the result returns over serial — giving the developer full access to the live system. Debug is demystified: it's a master driving ordinary transactions, with the serial link the only slow part.
8. Common Mistakes
9. Interview Insight
The debug subsystem shows the master abstraction's generality — explaining it (the DAP is an AHB master, debug is ordinary transactions, the serial link is the slow part) shows you understand how external access to a chip works.
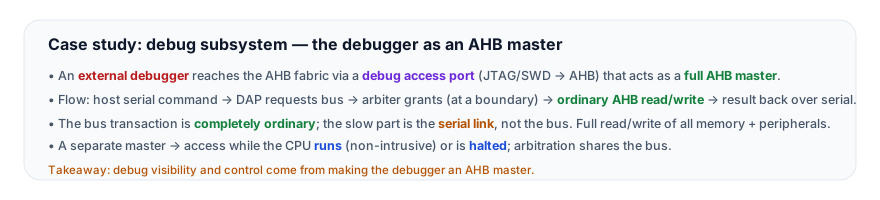
If asked how an external debugger accesses a chip, explain the master mechanism: a debug access port translates the slow serial debug protocol (JTAG/SWD) into AHB transactions and acts as a full AHB master, so the debugger can read/write all memory and peripherals by driving ordinary AHB transactions. Stress that the bus transaction is ordinary (the serial link is the slow part), that being a master gives full access via one uniform mechanism (no special debug bus), and that as a separate master the debugger can observe the live system non-intrusively (or halt for a snapshot), sharing the bus via arbitration. Mention the security flip-side (a master touches everything → debug gating/authentication in production). That shows you understand external chip access and the generality of the master interface.
10. Practice Challenge
Practice tracing the debug path.
- The flow. Trace a debug read — host serial command, DAP requests the bus, arbiter grants, ordinary AHB read, data back over serial.
- The master point. Explain why the DAP is a full AHB master (full access via one mechanism, no special debug bus).
- The bottleneck. Explain why the serial link (not the bus) is the slow part of debug.
- Non-intrusive. Explain what non-intrusive debug means and why the separate master enables it.
- Security. Explain why debug access is a security concern and how it's gated/authenticated.
11. Key Takeaways
- The debug subsystem makes the debugger an AHB master — an external debugger reaches the fabric via a debug access port (JTAG/SWD → AHB) that acts as a full AHB master.
- Debug is ordinary AHB transactions — the DAP drives ordinary reads/writes; the slow part is the serial link, not the bus.
- Full access via one mechanism — being a master gives the debugger access to every slave the decoder routes to. No special debug bus, no per-slave logic.
- The flow — host serial command → DAP requests the bus → arbiter grants (at a boundary) → ordinary AHB read/write → result back over serial.
- Non-intrusive (or halted) — as a separate master, the debugger reads the live system while the CPU runs (non-intrusive), or halts for a snapshot; arbitration shares the bus.
- The master interface is powerful (and a security concern) — it's the universal access point (CPU, DMA, debugger all become masters), so production chips gate/authenticate debug access.
12. What Comes Next
You can now explain debug access. The remaining case studies assemble and refine the full system:
- Microcontroller Bus Fabric (next) — assembling a full MCU AHB-Lite + bridge + APB fabric (all the pieces together).
- Low-Power Peripheral Access — gated, low-power access through the bridge.
To revisit the multi-master structure this trace applies, see DMA Master on AHB, Why Arbitration, HBUSREQ / HGRANT, HMASTER, and Master/Slave/Decoder/Arbiter.